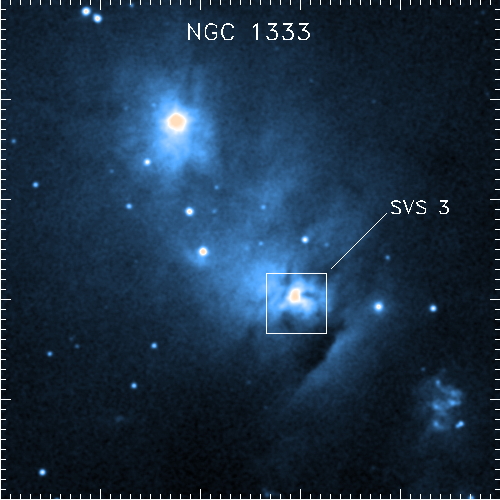
Fig. 1 (above). A Palomar Sky Survey plate of NGC 1333, in false color (the plates are actually black and white). The white box marks the area of the infrared image below (Fig. 2).
NGC 1333 is complex of nebulae created by star formation. We focus on the reflection nebula around SVS3, an early or mid B star. This nebula is a source of strong PAH emission (shown in the next image).

Fig. 2 (above). An image taken at 3.3 µm at the NASA 1.5 m telescope at Mt. Lemmon Observatory. Most of the emission at this wavelength is from PAH molecules. The long narrow rectangles mark the positions of our near-infrared and mid-infrared spectroscopy (below) in Fig. 3 and 5.
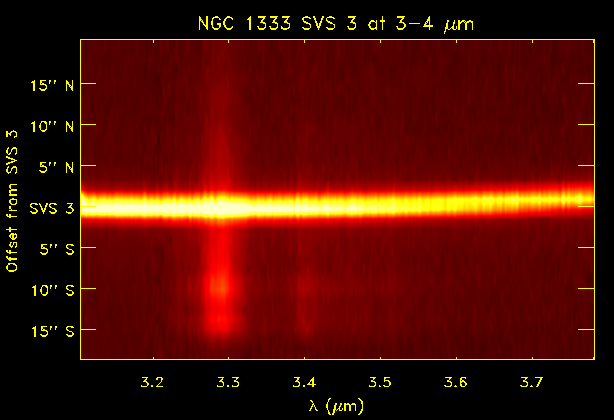
Fig. 3 (above). A long-slit spectral image of NGC 1333, obtained at the 3.8 m United Kingdom Infrared Telescope with CGS4 at wavelengths of 3.1-3.7 µm. In a spectral image, the wavelength of the light changes along the horizontal axis while the spatial position in the slit changes along the vertical axis. Spectra extracted from this image are shown below (Fig. 4).
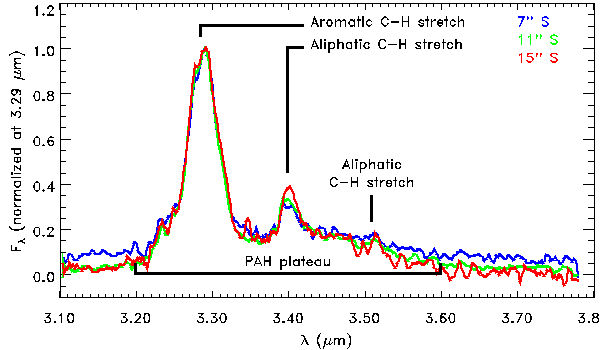
Fig. 4 (above). Spectra extracted from the long-slit 3 µm spectra in three regions south of SVS 3. As the distance from SVS 3 increases, the spectrum changes, with the contribution from the 3.40 µm PAH feature increasing with respect to the 3.29 µm PAH feature. The 3.29 µm PAH feature generally dominates this spectral region because it arises from a C-H stretch in the aromatic rings in the PAHs. The 3.40 µm PAH feature, on the other hand, arises from an aliphatic C-H stretch. This means that it does not come from the aromatic rings which dominate the spectrum, but from a C-H bond in some other structure. Since the feature is getting stronger with respect to the aromatic C-H stretch further away from SVS3, we can infer that the aliphatic C-H bonds are more fragile and cannot survive close to SVS3 where the radiation field is harsher.
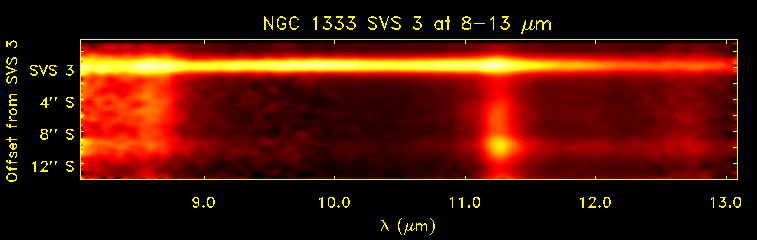
Fig. 5 (above). A long-slit spectral image of NGC 1333 in the mid-infrared, taken on the 5 m Hale reflector at Palomar with SpectroCam-10. The slit position is shown in Fig. 2, and spectra extracted from this image are shown below in Fig. 6.

Fig. 6 (above). Four spectra extracted from our mid-infrared spectral data of NGC 1333 by dividing the 16" slit into four 4" strips. The bottom panels show the 8.6, 11.2, and 12.7 µm features with the continuum subtracted for easy comparison. In all panels, the blue spectrum is on SVS 3, and the colors go through green, yellow, and red with increasing distance to the south.
The 8.6 µm feature behaves very differently from the 3.3, 3.4, 11.2, or 12.7 µm PAH features. While these latter features generally increase in strength to a maximum about south of SVS 3, the 8.6 um feature shows a broad region of emission peaking 5-8 arcsec south of SVS 3. Usually, the 8.6 µm PAH feature is attributed to in-plane C-H bends, while the 11.2, 11.9, and 12.7 µm features arise from out-of-plane C-H bends and the 3 µm feature arise from C-H stretches. The different behavior of the 8.6 µm feature either could arise from an in-plane C-H bend in a very different PAH species that we aren't seeing in other parts of the nebula, or from some other excitation mode enhanced closer in to SVS 3 (i.e., it may not be an in-plane C-H bend at all!).
We have discovered an emission feature at 10 µm centered on SVS 3 (blue curve in the top panel above) that does not appear elsewhere. We have also discovered very complicated spatial and spectral structure to the 11.2 µm PAH feature. Both of these points are illustrated and discussed below.

Fig. 7 (above). A more careful look at the 10 µm emission feature seen directly on SVS 3 (left) and the fine-scale structure in the 11.2 µm feature. Each curve is for a one-arcsecond strip, starting on SVS 3 (purple) and continuing through the rainbow to a position 8 arcseconds to the south (red). We have removed the continuum from each spectrum. To emphasize the variations in the 11.2 µm feature (right), we have normalized each row. We have not normalized the spectra of the 10 um feature (left).
There appear to be two extra features to the blue of the 11.2 µm feature, one at 10.8 and one at 11.0 µm. The 10.8 µm feature disappears quickly away from SVS3, but the 11.0 µm feature lingers out to a distance of 7-8" south. We suggest that the 10 µm and 10.8 µm feature arise from the same carrier, which can only exist in the immediate vicinity of SVS 3 , while the 11.0 µm feature exists from a carrier which can exist further away, although not out to 10 arcseconds where the stronger 11.2 µm PAH feature peaks.
In ionized PAHs, the 11.2 µm feature will shift to shorter wavelengths by ~0.3 µm, right to the vicinity of 10.8 and 11.0 µm where we see the new features. The spatial distribution of these features is also fully consistent with what would be expected for ionized PAHs - they appear only very near the exciting source.
We're pretty excited about all this. PAHs certainly produce the well-known emission features at 3.3, 3.4, 6.2, 7.7, 8.6, 11.2, and 12.7 µm, but generally, the fit between laboratory and astronomical data has been disappointing. Work by Hudgins and Allamandola shows that ionized PAHs provide a much better spectral fit, but there has been some doubt in the astronomical community about whether PAHs would actually be ionized in astrophysical environments, and if so whether they would survive long enough to be detected. Our results should eliminate these doubts.
Last modified 9 December, 2014. © Gregory C. Sloan.