Long-slit spectroscopy
Long-slit spectroscopy is a technique used to obtain both spatial and
spectral information at the same time.
The development of infrared detector arrays in the early 1980s led to
revolution in infrared astronomy. Before we had arrays, infrared astronomy
depended on measurements with single detectors. To obtain an image, the
telescope had to be raster-scanned across the sky, mapping the region of
interest one point at a time. Spectrometers had to obtain spectral data
one wavelength at a time - not the most efficient means of observing.
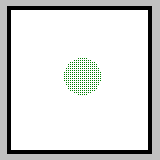
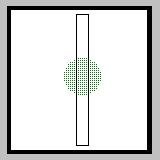 The most common use of infrared arrays is in cameras, which obtain
two-dimensional images (left), usually through various filters to
limit the light to a small range of wavelengths. Much of my research,
however, utilizes arrays in instruments known as long-slit spectrometers.
These instruments get their name from a long slit which blocks most
of the field, allowing only a narrow strip to pass through (right).
This radiation then passes through a dispersive device such as a prism
or diffraction grating which breaks it into its component
wavelengths.
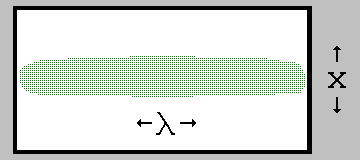 In a long-slit spectral image (right), the horizontal axis no
longer corresponds to a spatial direction in the sky - it now represents
wavelength. The vertical axis is still spatial, so that for
an extended source, a long-slit spectral image contains several
spectra, each corresponding to a different position in the slit,
or more precisely, a different part of the source along the slit.
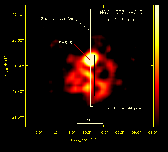
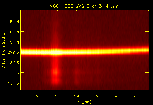 The (clickable) image to the left is a narrow-band image of NGC
1333 SVS 3. The long white rectangle shows the position of the slit used
to obtain the long-slit spectral image to the right.
In the narrow-band image, the central source dominates the total emission;
it shows up as a bright ribbon in the spectral image because it radiates
at all wavelengths covered. In the narrow-band image, there is more
emission in the slit south of the central source than to the north, and
this shows up in the spectral image as well, with stronger spectral emission
to the south than the north. Note the difference in the nature of the
spectrum off of the central source and on it. We can use the spectral
image to trace the variations in the spectral emission from NGC 1333
in this area. For more information on what we have learned about this
source, check out our on-line poster paper
on NGC 1333.
The power of this type of instrument lies in the ability to
obtain both spatial and spectral information simultaneously,
which allows the astronomer to search for changes in the spectral
behavior of a source with position. Much of my research has
capitalized on what long-slit
spectroscopy can tell us about the structure of dust shells produced
by dying stars and the complicated spatial and spectral behavior
of organic materials like polycyclic aromatic hydrocarbons.
 Home
Home
 Research
Last modified 9 December, 2014. © Gregory C. Sloan.

 The most common use of infrared arrays is in cameras, which obtain
two-dimensional images (left), usually through various filters to
limit the light to a small range of wavelengths. Much of my research,
however, utilizes arrays in instruments known as long-slit spectrometers.
These instruments get their name from a long slit which blocks most
of the field, allowing only a narrow strip to pass through (right).
This radiation then passes through a dispersive device such as a prism
or diffraction grating which breaks it into its component
wavelengths.
 In a long-slit spectral image (right), the horizontal axis no
longer corresponds to a spatial direction in the sky - it now represents
wavelength. The vertical axis is still spatial, so that for
an extended source, a long-slit spectral image contains several
spectra, each corresponding to a different position in the slit,
or more precisely, a different part of the source along the slit.
