PART I: THE TEMPERATURE AND COLORS OF STARS
Even to the ancients, it was obvious that stars have different brightnesses and colors. Now we know that a star's intrinsic luminosity is governed by its size (surface area) and its temperature. The measurement of a star's color, its spectral characteristics and its brightness help us to determine its physical properties, its distance, and its evolutionary status.
THE TEMPERATURE OF THE SUN
You know that hotter coals glow white, but they become redder as they cool off. Planck's law relates the amount of energy emitted by a perfect radiator ("blackbody") at a given wavelength to the temperature of the radiating object. If the temperature of the blackbody is known, the intensity of its radiation at any wavelength can be computed via Planck's Law. So, by comparing the intensity versus wavelength curves for blackbodies of known temperature, you can measure the "equivalent blackbody temperature" of any celestial object by measuring its observed intensity over a range of wavelengths. Of course, you could also ask whether or not the object behaves like a blackbody, by seeing whether its intensity variation resembles that of a blackbody.
In a given wavelength region, you can estimate the temperature of the Sun by seeing where its energy curve lies relative to the blackbody energy curves.
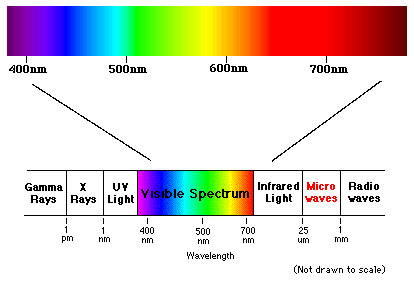
The electromagnetic spectrum is divided into several different wavelength regions: gamma rays, X-rays, ultraviolet radiation, ordinary visible light, infrared radiation, microwaves, and radio waves. Here is a schematic representation of the spectrum, with the visible portion expanded above.
Typically, the wavelength at which a star's radiation intensity is greatest lies somewhere within the visible portion of the spectrum, and thus corresponds to a color perceived by the human eye. If the peak wavelength lies near the blue end of the spectrum, the star will appear to have a predominantly bluish tint. Similarly, if the peak intensity lies near the red end of the spectrum, the star will appear predominantly orange or reddish. A star whose peak wavelength occurs near the middle of the visible spectrum will appear mostly white, rather than a specific color, because of to the blending of different spectral colors surrounding the peak wavelength.
First, let's take a look at some blackbody curves, using the JAVA Applet available by clicking here. You will be able to choose the temperature of up to 10 blackbodies, and plot their intensities relative to eachother. Choose the temperature by moving the slider along the bottom, and plot the curve by pressing the button labelled "New". You will notice that the intensity is greater in all areas of the spectrum for hotter objects than for colder. If you like, you can switch NORM to yes - this will plot each blackbody curve with a different scale, so they all have the same maximum amplitude on the graph.
You should notice two things:
Answer Questions 1 - 3 on the Worksheet Now
Each blackbody curve represents a blackbody at a specific temperature, and each curve peaks at a different wavelength, so you can figure out the temperature of a blackbody by measuring the wavelength at which its radiation intensity is greatest. Conversely, you can figure out the wavelength at which the radiation from a blackbody is greatest if you know the temperature of the blackbody.
This relationship is described precisely by WIEN'S LAW:
![]()
or, if you prefer:
![]()
where Blackbody Temperature is measured in degrees Kelvin, and the Peak Intensity Wavelength is measured in Angstroms.
Wien's law simply says that as a material gets hotter, the peak of its radiation shifts towards shorter wavelengths:
If the peak intensity wavelength of a blackbody lies within the visible
portion of the spectrum, the blackbody will radiate strongly in the spectral color
corresponding to the peak wavelength. Since hotter blackbodies peak at
correspondingly shorter wavelengths, they will appear bluer than blackbodies at lower
temperatures which have intensity peaks at longer, redder wavelengths.
The applet available here
will again let you examine sample blackbody curves, but this time you will also be able to
measure the wavelength of the peak. After entering a temperature, click the button
labeled Wien's Law in order to show how Wien's Law is obeyed.
Notice that the intensity curves are normalized, so that the emitted light appears
to peak at the same wavelength no matter what the temperature of the object.
Answer Questions 4 and 5 on the Worksheet Now
The graph in the applett here
shows a plot of intensity versus wavelength for the photosphere of the Sun, based on
observational data. Since the solar photosphere curve approximates a blackbody curve, the
temperature of the photosphere can be inferred by comparing it to blackbody curves of
known temperature. Once again remember that the blackbody curve shown is normalized.
Estimate the temperature of the Sun by fitting blackbody curves to the solar photosphere
curve (shown in white). Since the Sun is not a perfect radiator, its curve will not
match a blackbody curve at every wavelength. Instead, consider only the infrared portion
of the spectrum. Plot blackbody curves until you obtain a close match with the solar
photosphere curve in this region.
Now repeat the above activity, but this time estimate the temperature of the Sun from the visible portion of the spectrum.
Wien's Law relates the temperature of a blackbody to the wavelength at which its emission intensity peaks. You can also use Wien's Law then to estimate the temperature of the solar photosphere. Do so.
Answer Questions 6 - 10 on the Worksheet Now
You have now measured the temperature of the sun by two different methods: PLANCK's Law and WIEN's Law. It is obvious that different methods give different answers. The concept of "temperature" is not always straightforward.
SPECTRAL LINES
In the first part of this lab, we have looked only at the smoothed variation with wavelength of a star's intensity. We can think of this as the variation of the CONTINUUM of the emitted starlight.
Because a star's atmosphere is not at the same temperature as the photosphere, we will also observe discrete SPECTRAL LINES, superimposed on the smooth continuum. Hence, we can get an idea of the temperature and color of a star from the smoothed continuum, but the observation of the spectral lines introduces a lot of additional clues as to the physical properties of the star.
Below, you can see the spectrum of the Sun, with some of the most prominent absorption lines visible in black. The strongest lines in the solar spectrum are called the FRAUNHOFER LINES. The top picture is an original sketch, drawn and colored by Fraunhofer, while the bottom one is a photographed spectrum.
.![]()
Notice that the continuum radiation is still much stronger than the lines. There are actually thousands of lines in the spectrum, but only these stand out from the continuum because they are the darkest lines.
The lines that you can see are lines of: hydrogen (H I), iron (Fe I), calcium (Ca II), magnesium (Mg I) and sodium (Na I). You will look at some of the same lines in emission when you use the spectroscopes to look at gas tubes.
 Notice the difference between
absorption and emission spectra. The lines you have just observed were part of an
absorption spectrum . . . with the various elements/molecules interposed between the
radiating blackbody (the sun) and the observer. Those you are observing next will be
emission spectra, with the gas molecules emiting light at their characteristic frequencies
as they are excited.
Notice the difference between
absorption and emission spectra. The lines you have just observed were part of an
absorption spectrum . . . with the various elements/molecules interposed between the
radiating blackbody (the sun) and the observer. Those you are observing next will be
emission spectra, with the gas molecules emiting light at their characteristic frequencies
as they are excited.
In the next part of this lab, you will examine the spectra of several
gases and learn how to recognize a specific gas by the charactistic spectrum it emits. You
will not use the computer for that part of the lab.
Thank you to Mike Guidry for letting me use and modify some of his astronomy JAVA Applets!
(and also to http://www.landkreis-cham.de/schulen/jvfgcham/fraun_uk/linien.htm, http://www.physics.sfasu.edu/astro/color.html, and http://super.colorado.edu/~astr1020/)