Spectra of stars

Contents

The electromagnetic spectrum

Light can be thought of as particles or waves. When light behaves as a particle, we say that it consists of photons. When light behaves as a wave, then it's an electromagnetic wave, with an electric field and a magnetic field, both of which vary in strength just like a wave in the ocean varies in height. If you change the wavelength of light, you change its color. Most of the colors light can take are completely invisible to us, because our eyes can see only a small range of wavelengths.

Optical light, that is the part we can see, can vary from red, which has the longest wavelengths, to blue and then purple, which has the shortest wavelength. Roughly, red light has a wavelength of about 700 nanometers (nm). One nanometer is one billionth of a meter. I like to write wavelengths in micrometers, usually referred to as "microns" (or µm). Then, red light is at about 0.7 µm. At the other end of the spectrum is purple, at about 0.4 µm.

If we keep going to shorter wavelengths, we hit ultraviolet, then X-rays, and finally gamma rays. Photons with shorter wavelengths pack more energy. That's why the medical technician is so careful with all the lead shielding when taking X-rays: they're dangerous. Gamma rays are even more dangerous, and a strong dose of those will kill you quickly. Even UV isn't safe, as anyone who has had a bad sunburn knows. And of course, there's skin cancer, too.

The other side of the spectrum, if we keep going past red, is of more interest to me, because those are the wavelengths where I've done most of my astronomy research. First we come to the infrared, which I like to break up into the near infrared, which is from about 0.7 to 3 µm, then the mid or thermal infrared, from about 3 to 30 µm. Beyond that, you're in the far infrared, until you get to wavelengths of a few hundred µm. Since 1000 µm = 1 mm, astronomers refer to that region of the spectrum as the sub-millimeter. Keep going, and you're in the radio regime.

Blackbodies

Most objects emit roughly (very roughly) as blackbodies. The idealized blackbody absorbs every photon that hits it, which is why it's called "black", and it re-emits the energy it absorbs at all wavelengths. The re-emitted spectrum depends on the temperature of the blackbody, with hotter objects emitting more high-energy photons, which are those with the shortest wavelengths, and cooler objects emitting more at longer wavelengths.

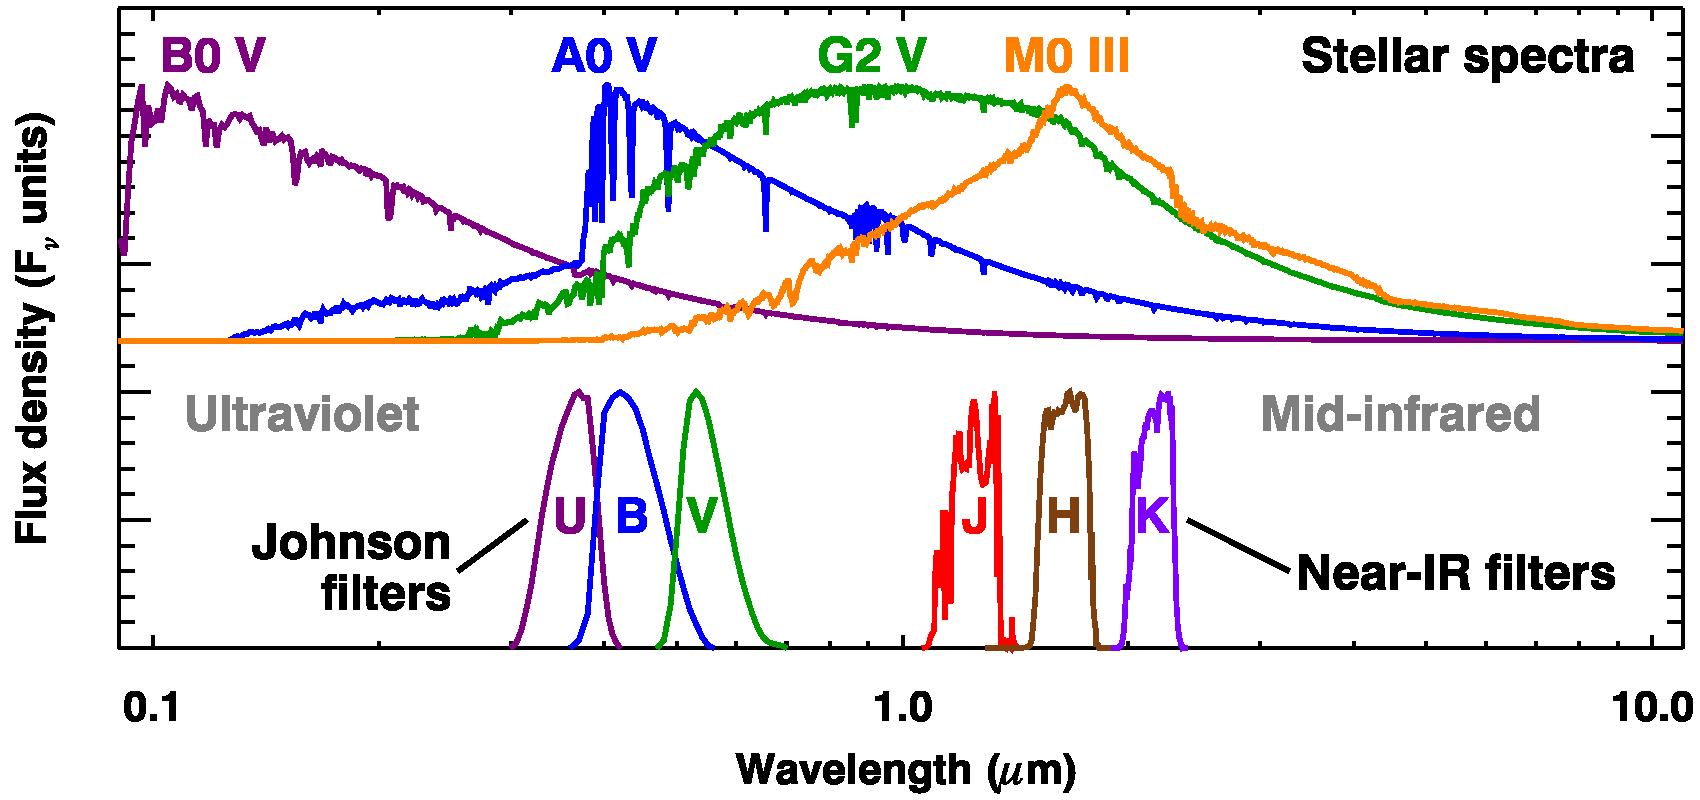
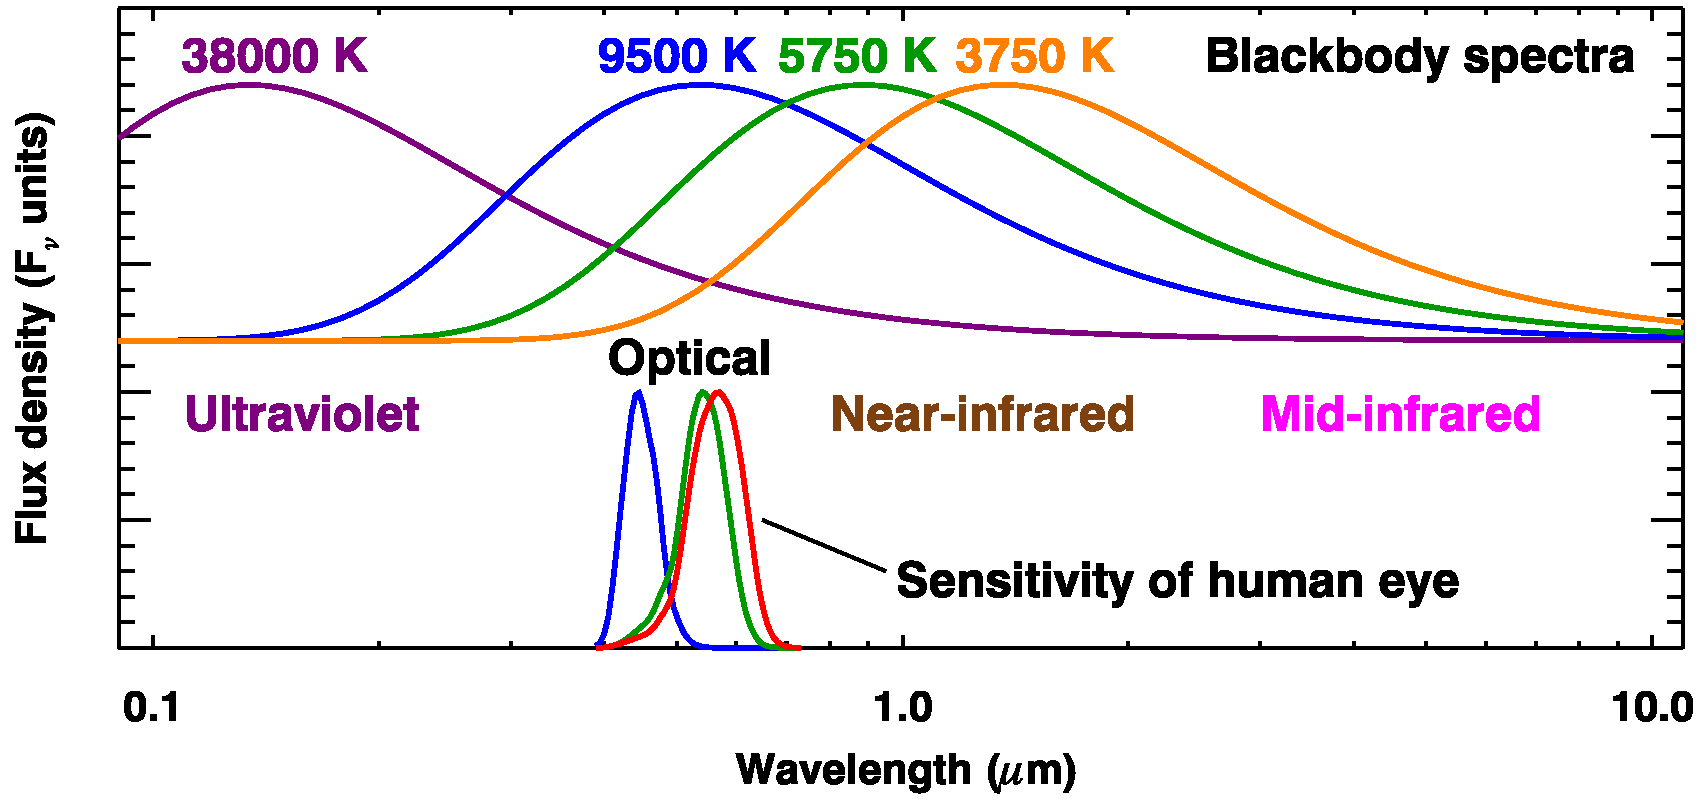
The figure above shows blackbody curves for four temperatures: 38,000 K, which is a really hot star (spectral class B0 V), 9,500 K, which is close to the temperature of Vega (A0 V), 5,750 K, close to the temperature of the Sun (G2 V), and 3,750 K, a red giant (M0 III). (On the Fahrenheit scale, these are 68,000, 16,600, 9,900, and 6,300 degrees).

Also shown are the response curves for the human eye, to give an idea of which part of the spectrum the eye can see. The hottest star plotted emits most of its radiation in the ultraviolet and even shorter wavelengths. The coolest star emits mostly in the near-infrared.

What stellar spectra really look like

The figure above shows what the spectra from stars actually look like (using model spectra by Castelli and Kurucz 2004). The blackbody curves plotted in the previous figure are only rough approximations, because they don't account for how atoms and molecules absorb certain wavelengths of light. Atomic hydrogen produces most of the features in the spectra of the hottest two stars, accounting for both the narrow divots and the huge chunks missing from the B0 star at 0.091 µm and the A0 star at about 0.38 µm. In the spectrum of the M0 star, molecules are responsible for most of the divots in the spectrum, with titanium oxide bands noticeable at wavelengths below 1 µm and carbon monoxide bands at longer wavelengths (2.4 and 4.8 µm).

Infrared spectra and dusty stars

The figure above shifts the wavelength range further into the infrared, from about 3.5 µm out past 30 µm. The bottom spectrum looks much like the M0 star in the previous figure. The spectrum shows absorption bands from molecules, CO at 4.8 µm and SiO at 8 µm, and it doesn't show any emission from dust, like the other three spectra.

All of the stars in this figure are on the asymptotic giant branch, which is their final stage of evolution as a star. As they die, they eject much of their mass into space, and dust condenses in a thick shell around them. By looking their spectra in the infrared, we can learn about the kind of dust they produce. The figure above gives a few examples highlighting the different kinds of dust we can observe.

The top spectrum is Mira, a well-known variable star associated with a lot of silicate dust, which produces two strong emission features at 10 and 18 µm. The next spectrum down shows unusual dust emission, with more structure than Mira. Of particular interest (to me anyway!) is the emission feature at 13 µm. I've published a few papers on this feature, which most likely arises from crystalline alumina dust. In the spectrum of T Cas, the only dust emission apparent is a broad low-contrast feature from 10 to 13 µm produced by amorphous alumina dust. (If you look closely, you can see a hint of the 13 µm feature from crystallina alumina, too.)

Carbon stars

The figure above shows the infrared spectra of carbon stars. In most stars, there is more oxygen than carbon, but stars on the asymptotic giant branch are fusing helium into carbon and dredging that carbon to their surface. With enough dredge-ups, the surface of the star becomes carbon-rich and the chemistry changes completely. CO locks up all of the available oxygen, and the star makes carbon-rich molecules (like C2H2, more commonly called acetylene) and carbon-rich dust, like amorphous carbon, SiC, and MgS.

The bottom spectrum, of TX Psc, shows a carbon star that isn't losing a lot of mass or making a lot of dust. The middle spectrum, V Cyg, is much dustier and shows a strong emission feature from SiC dust and strong absorption bands from acetylene molecules. Amorphous carbon dust is also present. It doesn't produce any emission features; it just reddens the entire spectrum. The top spectrum of IRC +40540 is dominated by emission from amorphous carbon, plus the usual emission and absorption features. The dust shell around this star is so thick that it is very faint in the optical spectrum. The dust is cool enough for MgS to condense onto the grains, which produces the feature at 26-30 µm.

References

Castelli, F., & Kurucz, R.L. 2004, New grids of ATLAS9 model atmospheres, in Modelling of Stellar Atmospheres, ed. N. Piskunov et al., IAU Symposium 210, A20, arXiv 0405087.


Home Research

Last modified 29 December, 2014. © Gregory C. Sloan.