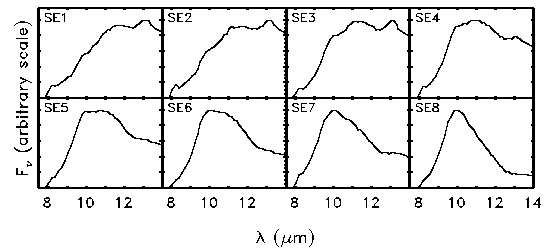
Fig. 1. Sample dust spectra for each SE class. Each spectrum is the sum of all AGB sources of that class, after removal of the stellar contribution.
G.C. Sloan (NASA Ames), I.R. Little-Marenin (Wellesley), S.D. Price (Phillips Lab./GPOB)
1996, in From Stardust to Planetesimals: Contributed Papers , ed. M.E. Kress, A.G.G.M. Tielens, & Y. Pendleton NASA-CP 3343, 65 (Moffett Field, CA: NASA)
We present results from an ongoing effort to classify the infrared spectra produced by circumstellar dust shells. Earlier efforts (described by Sloan et al. 1994) concentrated on oxygen-rich dust shells from sources associated with the asymptotic giant branch (AGB). Here, we describe the expansion of our classification to include S stars, supergiants, and carbon stars.
Sloan & Price (1995) defined a sample of bright AGB sources found by cross-referencing the General Catalog of Variable Stars (Kholopov et al. 1985-1988) with the IRAS Point Source Catalog (1988). Their sample contained 546 Mira, SRa, SRb, and Lb variables classified as M or K stars optically. For each source they classified the spectrum from the IRAS Low-Resolution Spectrometer by first removing the contribution from the stellar photosphere and then assigning the spectrum to one of several general emission classes (see Table 1).
| Class | Description |
|---|---|
| N | Naked (no dust) |
| SE | Silicate (and oxygen-rich dust) Emission |
| SB | Silicate self-aBsorbed emission |
| SA | Silicate Absorption |
| CE | Carbon-rich dust Emission |
| H | very red spectrum (H II region) |
| P | Peculiar (or noisy) |
For SE sources, they used the flux ratios of the dust emission at 10, 11, and 12 µm to classify the spectrum. They found that when plotting F10/F12 vs. F10/F11, the spectra defined a narrow curve, which they identified as the silicate dust sequence. They used this sequence to improve on the classification system introduced by Little-Marenin & Little (1988, 1990), dividing it into eight segments, labelled SE1-8. SE1 spectra have low flux ratios and could be described as broad, low-contrast features peaking ~12 µm. SE8 spectra have high flux ratios and represent the classic, narrow silicate feature at 10 µm. In between are the structured silicate emission classes. Figure 1 illustrates all eight SE classes.

Fig. 1. Sample dust spectra for each SE class.
Each spectrum is the sum of all AGB sources of that class, after
removal of the stellar contribution.
As discussed in more detail by Sloan & Price (1995, 1996), amorphous silicates produce classic silicate emission, amorphous alumina may explain the broad SE spectra, and crystalline silicates provide the best explanation for the structured SE spectra.
Sloan, LeVan, Little-Marenin (1996) presented the results of a search for sources of the 13 µm emission feature (readily visible in the SE1-4 spectra in Fig. 1). They found that all types of emission spectra from oxygen-rich dust (broad, structured and classic) show a 13 µm feature. They estimated that up to ~50% of all SE spectra exhibit this feature, though low signal/noise prevents its detection in many sources. Among the bright SRb variables, over 90% showed a 13 µm feature, compared to only 20% of the bright Miras. The carrier of this feature seems to be diminished when the central star shows the strong and steady pulsations associated with Mira variables. One possible candidate for the carrier is crystalline alumina.
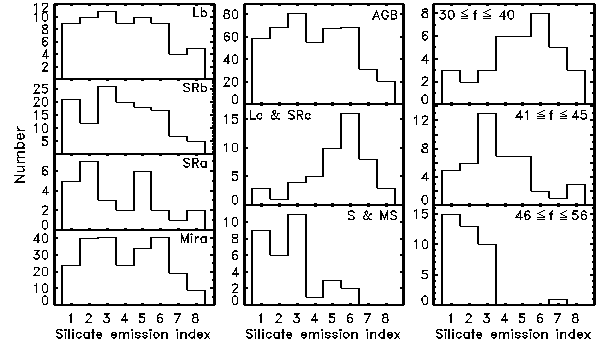
Sloan & Price (1996) expand the AGB sample to include 24 S stars and 65 supergiants (variability class SRc or Lc). They supplement the small S star sample with 19 MS stars from the AGB sample. As shown in Figure 2, the distributions of classes of oxygen-rich dust spectra among the four variability classes in the AGB sample show no obvious differences. However, the AGB sample as a whole differs significantly from the supergiants, which tend to show classic silicate emission, and the S and MS stars, which concentrate strongly in the broad emission classes. Furthermore, separating the Mira variables by the shape of their light curves reveals that stars with symmetric light curves (f ~ 50) show only broad emission while stars with more asymmetric light curves have more classic silicate emission (as first pointed out by Vardya et al. 1986). It is suprising that the four variability classes in the AGB sample have such similar spectral distributions when considering how the distributions vary with the shape of the light curve among the Miras and how the percentage of 13 µm sources changes with variability class.

Fig. 2. Left: The distribution of
SE classes for the variables associated with the AGB.
Center: A comparison of the AGB sample
with the supergiants and S and MS stars.
Right: The Miras separated by the asymmetry of their light
curve (f = 100 x rise time/total period). Miras with the most
asymmetric light curves and the supergiants tend to show classic
silicate emission (SE6-8) while Miras with more symmetric light
curves and the S and MS stars tend to show broad emission profiles
(SE1-3).
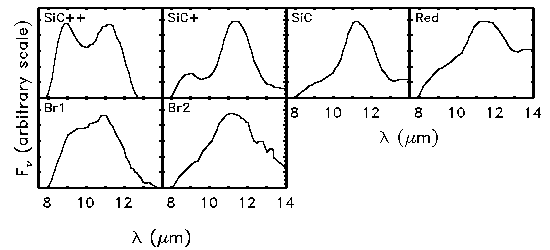
Sloan, Little-Marenin, & Price (1996) examine the sample of 96 carbon stars associated with the AGB (see also Little-Marenin, Sloan, & Price 1996). Nearly all of the sample show dust emission, although three sources have oxygen-rich dust (two are the well-known silicate/carbon stars BM Gem and V778 Cyg). The remainder of the sample belong to one of six classes (Fig. 3).

Fig. 3. The classes of carbon-rich dust
emission, determined as in Fig. 1 and smoothed slightly.
Four classes fall along a sequence: SiC++ — SiC+ — SiC — Red. The SiC++ and SiC+ sources have an emission feature near 8.5-9.0 µm accompanying the more common 11.2 µm emission feature attributed to SiC. Moving along the sequence to SiC and Red, the percentage of Miras increases while the feature around 9 µm decreases in strength, to be replaced by a cool continuum attributed to graphite or amorphous carbon. The 9 µm feature may arise from a precursor to graphite (Goebel et al. 1995). This sequence may represent the evolution from a thin to a thick shell produced as the pulsation of the central star steadies, increases in period and amplitude, and drives the mass-loss to extremely high rates.
Two additional classes, identified as Broad 1 and Broad 2, show unusual spectral emission which may be related to the 11.2 µm SiC feature.
Goebel, J.H., Cheeseman, P., & Gerbault, F. 1995, ApJ,
449, 246.
IRAS Point Source Catalog, Version 2.0. 1988, Joint IRAS Science
Working Group (Washington: GPO).
Kholopov, P.N., et al. 1985-1988, General Catalogue of Variable
Stars (4th Ed.; Moscow: Nauka and Greenbelt: NASA Astronomical Data
Center) (GCVS).
Little-Marenin, I.R., & Little, S.J. 1988, ApJ, 333, 305.
_____. 1990, AJ, 90, 1173.
Little-Marenin, I.R., Sloan, G.C., & Price, S.D. 1996, in IAU
Symposium 177: The Carbon Star Phenomenon, ed. R.F. Wing, in press.
Sloan, G.C., LeVan, P.D., & Little-Marenin, I.R. 1996, ApJ,
463, 310.
Sloan, G.C., Little-Marenin, I.R., LeVan, P.D., & Price S.D. 1994,
in Airborne Astronomy Symposium on the Galactic Ecosystem: From Gas
to Stars to Dust, ed. M.R. Haas, J.A. Davidson, & E.F. Erickson (San
Francisco: ASP), 425.
Sloan, G.C., Little-Marenin, I.R., & Price, S.D. 1996, in preparation.
Sloan, G.C., & Price, S.D. 1995, ApJ, 451, 758.
_____. 1996, in preparation.
Vardya, M., de Jong, T., & Willems, F. 1986, ApJ, 304, L29.
Last modified 5 June, 2008. © Gregory C. Sloan and others.