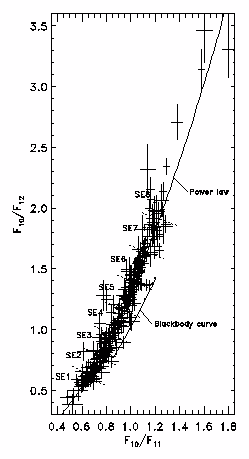
Figure 1. The silicate dust sequence for all sources with emission of S/N 10 or more. The points along the blackbody curve are for (top to bottom) 104 K, 3000 K, 1000 K, and 300 K.
G. C. Sloan (NASA Ames), S. D. Price (Phillips Lab., Hanscom AFB), I. R. Little-Marenin (Colorado), P. D. LeVan (Phillips Lab., Kirtland AFB)
1995, in Airborne Astronomy Symposium on the Galactic Ecosystem: From Gas to Stars to Dust, ed. M.R. Haas, J.A. Davidson, & E.F. Erickson, ASP Conf. Series, 73, 425 (San Francisco: ASP).
The Low-Resolution Spectrometer (LRS) on the Infrared Astronomical Satellite (IRAS) produced a rich set of spectra from oxygen-rich circumstellar dust shells. Little-Marenin and Little (1988, 1990) found that in addition to the classic 10 µm emission feature due to silicate dust, many oxygen-rich shells also produce components at 11 and 13 µm. Some shells exhibit only a broad, low-contrast feature which peaks longward of 11 µm and has been attributed to alumina dust (Vardya, de Jong and Willems 1986; Onaka, de Jong and Willems 1989). We have modified the classification method of Little-Marenin and Little, applied it to a large sample of bright oxygen-rich variables on the asymptotic giant branch (AGB) (Sloan & Price 1994), and undertaken a study of the 13 µm emission feature and the sources which produce it (Sloan, LeVan, & Little-Marenin 1994). We present some of the results of these studies here.
We created our sample of AGB sources by cross referencing four classes of variables (Mira, SRa, SRb, and Lb) in the General Catalog of Variable Stars (Kholopov et al. 1985-88) with stars brighter than 28 Jy in the IRAS Point Source Catalog (IPAC 1987). Of the 683 matches, 546 have optical spectral types indicating oxygen-rich photospheres: 241 Miras, 29 SRas, 157 SRbs, and 119 Lbs.

Figure 1. The silicate dust sequence for all
sources with emission of S/N 10 or more. The points along the
blackbody curve are for (top to bottom) 104 K, 3000 K,
1000 K, and 300 K.
For each of these, we obtained a spectrum from the LRS (IRAS Science Team 1986, Volk and Cohen 1989), corrected it as described by Cohen, Walker, and Witteborn (1992), and following Little-Marenin and Little, removed the stellar contribution. We assumed that all of the stars could be approximated as M6 giants, and modeled them with a 3240 K Engelke function (Engelke 1992) with 15% SiO absorption at 8 µm. We defined the dust contrast to be the ratio of dust to stellar emission summed from 8 to 15 µm. Spectra with dust contrasts of 4% or less were classified as naked (N). Nearly all remaining spectra contained silicate or related dust emission (SE).
For emission spectra, we examined the dust emission at 10, 11, and 12 µm. We found that a plot of the flux ratios F10/F12 versus F10/F11 (Figure 1) produces a tight curve, which, for ease of reference, we refer to as the silicate dust sequence. This sequence can be modelled with a power law:
F10/F12 = 1.32 (F10/F11)1.77.
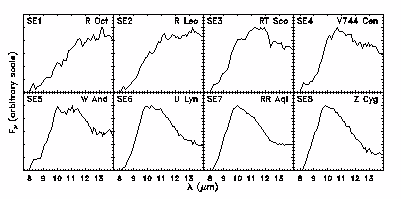
For each spectrum, we determine a SE index by finding the position on the power law closest to the position defined by the flux ratios F10/F11 and F10/F12. Using the corrected flux ratios on the power law, we solve for the flux ratio F11/F12. The SE index is defined as:
n = 10 F11/F12 - 7.5.

Figure 2. Sample spectra for each silicate
emission index. The stellar contribution has already been
removed.
Glaccum (1994) has tentatively identified the carrier of the 13 µm emission feature as corundum (alpha-Al2O3), a crystalline form of the alumina dust associated with the broad low-contrast feature (SE1-2). We find that 13 µm emission is far more common than previously thought. Of the brightest SRbs, 90% have spectra with 13 µm features. Roughly half the bright Lbs and SRas also show 13 µm emission, but very few of the Miras do. The 13 µm feature occurs more frequently among broader emission classes, but can be found associated with all types of emission from oxygen-rich dust.
Cohen, M., Walker, R.G., & Witteborn, F.C. 1992, A.J.,
104, 2030.
Engelke, C.W. 1992, A.J., 104, 1248.
Glaccum, W. 1994, in Proc. of the Airborne Astronomy Symp. on
the Galactic Ecosystem: From Gas to Stars to Dust, ed. M.R.
Haas, J.A. Davidson, & E.F. Erickson (San Francisco: ASP), paper
5.2.
Image Processing and Analysis Center 1987, IRAS Catalog of Point
Sources, Version 2.0 (Washington: GPO).
IRAS Science Team 1986, A&AS, 65, 607.
Kholopov, P.N., Samus, N.N., Frolov, M.S., Goranskij, V.P.,
Gorynya, N.A., Kireeva, N.N., Kukarkina, N.P., Kurochkin, N.E.,
Medvedeva, G.I., Perova, N.B., & Shugarov, S.Y. 1985-88, General
Catalogue of Variable Stars, 4th Ed., (Moscow: Nauka Publishing
House).
Little-Marenin, I.R., & Little, S.J. 1988, Ap.J.,
333, 305.
_____. 1990, A.J., 99, 1173.
Onaka, T., de Jong, T., & Willems, F. 1989, A&A, 218,
169.
Sloan, G.C., LeVan, P.D., & Little-Marenin, I.R. 1994, in
preparation.
Sloan, G.C., Price S.D. 1994, Ap.J., submitted.
Vardya, M., de Jong, T., & Willems, F. 1986, Ap.J.,
304, L29.
Volk, K., & Cohen, M. 1989, A.J., 98, 931.
Last modified 25 January, 1999. © Gregory C. Sloan and others.