See our ApJ paper on this comparison.
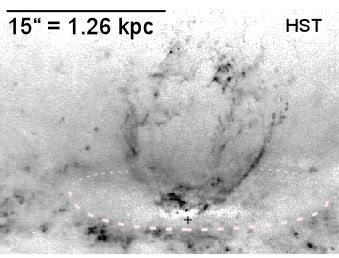
The HST image was made by subtracting the I-band continuum F814W image from
F658N, leaving H-alpha+[N II]6583 line emission.
The Chandra image is a 26 ksec exposure
from the archive (P.I. Strickland), obtained with the ACIS instrument and
smoothed to 0."8 arcsec FWHM. Marked are
striking correlations between filamentary networks in the two wavebands.
The two networks appear to coincide spatially
within the +/-0."4-arcsec registration uncertainty that we have attained
so far. The nucleus is optically obscured but
prominent in the Chandra image (marked as +).
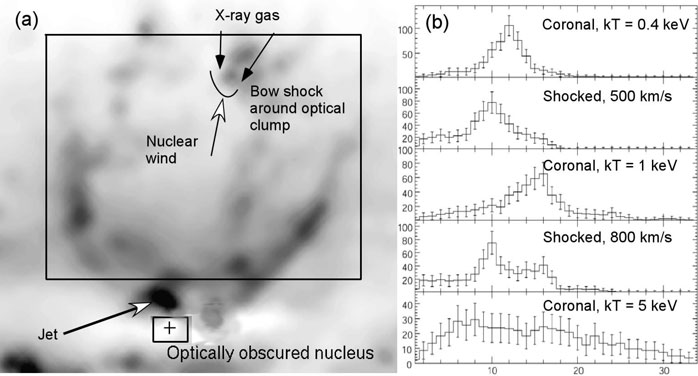
The deeper 90-ksec exposure proposed for Chandra cycle 13, when combined
with the image above should reveal
X-rays from all 4 "towers" of optically emitting filaments at a resolution
of about 0."7 FWHM, and would also have
sufficient counts to provide X-ray spectra at several points across the
superbubble, not just spatially integrated across the bubble. The figure
below shows the expected resolution of this longer exposure, and the spectra
that would be extracted over a few regions
depending on whether the gas is in ionization equilibrium, or is shocked.
I am also preparing a multi-configuration EVLA program to map the larger
radio bubbles in multiple frequencies to establish the topology of the
magnetic field. We are working on MHD and gas-dynamical 3D simulations of
the flow.